Mizoram Civil Service Exam Notes | Environment Series
In Lecture 1 we covered the basics of Ecology, biotic and abiotic factors. In this post we go deeper into two key branches — Population Ecology and Community Ecology — both of which are heavily tested in UPSC and MPSC exams.
Ecology Concepts: Hierarchy of Life
Before diving in, here’s the full hierarchy of life from smallest to largest:
Atom → Molecules → Cells → Tissues → Organs → Organ System → Organisms → Population → Community → Ecosystem → Biome → Biosphere
Levels of Ecological Studies:
- Population
- Community
- Ecosystem
- Biome
Exam Question: Which is the smallest unit of ecological analysis?
Answer: (b) PopulationMPSC 2015: Ecology as a discipline directly deals with all levels of biological organisation except?
Answer: (b) Cellular
I. Population Ecology
Definition: Branch of ecology that studies the structure and dynamics of a population.
- Population = smallest unit of ecological analysis
- A population is defined as “a group of interbreeding and interactive individuals of the same species inhabiting the same area at a given point of time”
Age Distribution in Population
There are 3 age groups in any population:
| Age Group | Description | Contribution to Population |
|---|---|---|
| Pre-reproductive | Juveniles | Do NOT contribute to population increase |
| Reproductive | Sexually mature, actively reproducing | Contribute to population growth |
| Post-reproductive | Beyond reproduction, ageing group | Do NOT contribute |
(Note: Post-reproductive group is not important in ecology — similar concept to “demographic dividend” in economics)
Age Structure Diagrams (Population Pyramids)
There are 4 stages of population growth shown by age structure diagrams:
| Stage | Pattern | Characteristics | Example Countries |
|---|---|---|---|
| Stage I | Rapid growth | High birth rate & high death rate; low life expectancy (<65) | Somalia, Kenya |
| Stage II | Slow growth | Reduced death rate, >65 y/o increasing; Rapidly declining death rate due to improved healthcare; expanding youth base | India |
| Stage III | Stable | Low death rates balanced by heavily reduced birth rates | USA, UK |
| Stage IV | Shrinking | Birth rates drop below death rates; aging population crisis | Japan, Italy, Germany |
UPSC 2011: Which age pyramid shape indicates a declining population?
Answer: (c) — the diamond/declining shapeExam Question: Which type of age pyramid represents a stable population?
Answer: (b) Bell-shaped age pyramid
Population Growth
Population growth depends on 4 factors:
- Fecundity and Natality (Absolute and Realised)
- Death (Mortality)
- Immigration
- Emigration
Key Definitions:
- Fertility → ability to give birth
- Fecundity → similar to fertility, but specifically the actual number of offspring an individual organism gives birth to
- Natality → number of individuals born per total population, i.e., the birth rate
MPSC 2012: Emigration is?
Answer: (b) One-way movement of individuals out of a population to another areaExam Question: Population growth is NOT dependent on?
Answer: (d) Migration
Patterns of Population Growth
Two main growth curves:
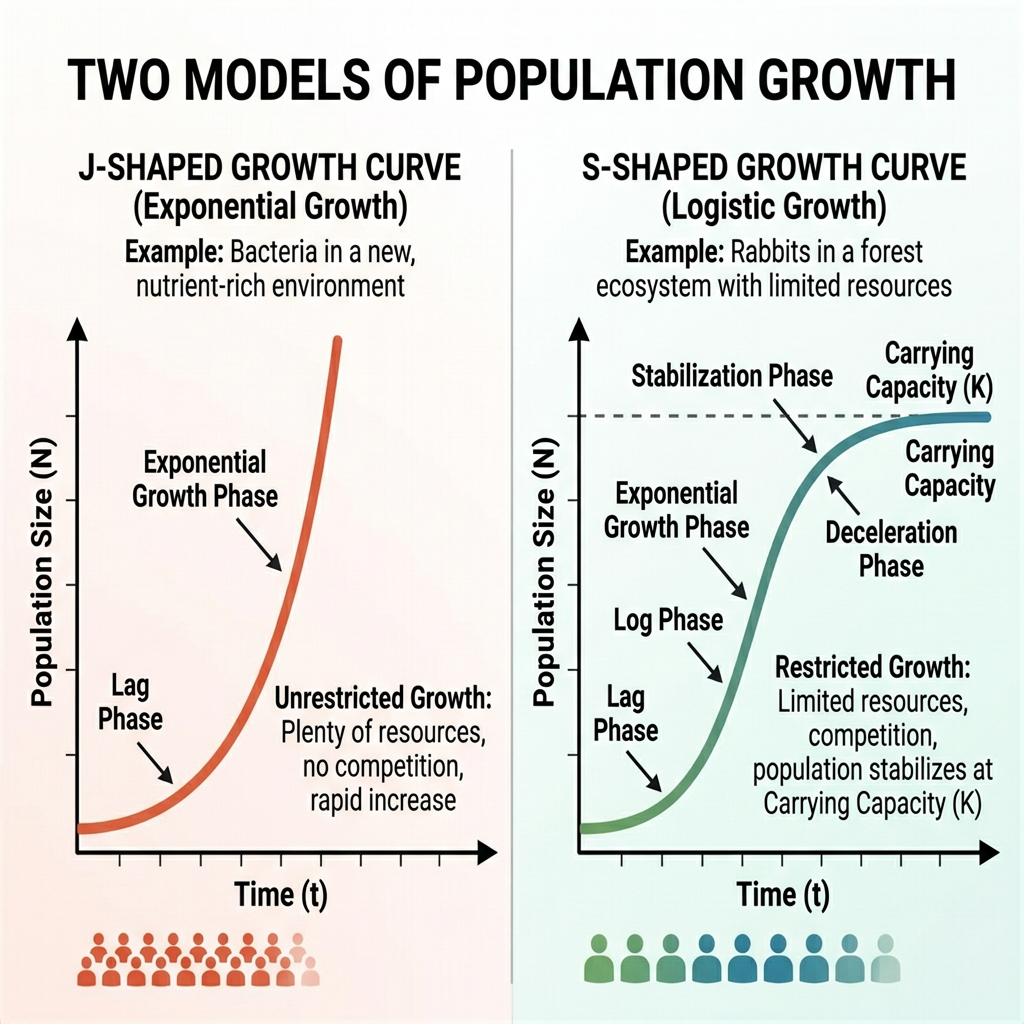
J-Shaped Curve (Exponential Growth)
- Very rapid increase in population
- Occurs when a new species is introduced into an area
- No limiting factors initially
S-Shaped Curve (Logistic Growth)
- Population increases and then stabilizes when it reaches the carrying capacity
- More realistic in nature
- Example: In Gir Forest, lion population exceeded carrying capacity
Population Stabilization
Population is regulated by 2 types of factors:
Density Independent Factors
- Food, space, shelter, weather
- (Delhi → 11,000/sq.km; Mumbai → 28,000/sq.km)
Density Dependent Factors
- Competition, predation, emigration, reproduction, diseases, etc.
- Example: Panda — population affected by density dependent factors
MPSC 2012: Which is NOT a density dependent factor for population stabilization?
Answer: (b) Weather
II. Community Ecology
What is an Ecological Community?
- An assemblage of species populations that has the potential for interaction
Definition by Padua, 1991:
“An interactive assemblage of species occurring together within a particular geographical area, a set of species whose ecological function and dynamics are in some way interdependent.”
Inter-Specific Associations in a Community
The interactions between two species (Species A and Species B) can be categorized as:
| Species A | Species B | Name of Interaction | Example |
|---|---|---|---|
| + | + | Mutualism (a.k.a. Symbiosis / Proto-cooperation) | Crocodile + Bird; Honeybee + Flower |
| – | – | Competition | Tiger & Lion (fight) |
| + | – | Predation | Tiger & Deer (bigger eats smaller) |
| + | – | Parasitism | Tick & Cow (smaller harms bigger, sucks blood) |
| + | # 0 | Commensalism | Cow & Cow dung beetle |
| – | # 0 | Amensalism | Big tree & small tree/plant (sunlight blocked, nutrition absorbed by bigger) |
| 0 | 0 | Neutralism | Tarantula & Cactus (also not believed by scientists to exist in nature) |
(+) = advantage/help | (–) = disadvantage/harm | (0) = neutral
Exam Question: A relationship between 2 species where one benefits while the other is harmed?
Answer: (c) ParasitismExam Question: A frog eats a grasshopper. They are demonstrating?
Answer: (c) PredationExam Question: Relationship where one benefits and the other is unharmed?
Answer: (c) CommensalismExam Question: A tapeworm and a cat have what relationship?
Answer: (b) Parasitism
Ecotones
- An Ecotone is an area or zone of transition between two or more diverse communities
- In gradually blended interface areas, species from each community will be found together as well as unique local species
- Example: Mangrove ecosystem (transition between land and sea)
- A river reaching the ocean → its mouth is called an Estuary (has both fresh and saline water)
Exam Question: The gradually blended interface area which is a zone of transition between 2 diverse communities is called?
Answer: (b) Ecotone
Edge Effect
- Both the number of species and population density of some species is greater in the ecotone than in the communities flanking it
- This tendency for increased variety and density of species in a community is known as the Edge Effect
- Species that use the edges are called Edge Species (e.g., Mangroves)
Exam Question: Tendency of increased variety and density of species of a community in an ecotone is known as?
Answer: (a) Edge Effect
Quick Revision Summary
| Topic | Key Point |
|---|---|
| Smallest ecological unit | Population |
| 3 age groups | Pre-reproductive, Reproductive, Post-reproductive |
| Stage I population | Rapid growth — high birth & death rate |
| Stage IV population | Shrinking — low birth & death rate (USA, UK) |
| J-curve | Exponential growth (new species introduced) |
| S-curve | Logistic growth (stabilizes at carrying capacity) |
| Mutualism | Both species benefit (+/+) |
| Parasitism | One benefits, one harmed (+/–) |
| Commensalism | One benefits, other unaffected (+/0) |
| Ecotone | Transition zone between two communities |
| Edge Effect | Higher species diversity in ecotone zones |
These notes are based on my personal coaching class notes for Civil Services Exam preparation.
Read Lecture 1 [here] | Stay tuned for Lecture 3 — Keystone Species & Ecological Niche!
Found this helpful? Share it with fellow aspirants!
1 thought on “Population Ecology & Community Ecology – Lecture 2 | Civil Service Exam Notes”